

As a business owner, your pay is often dependent on the bottom line at the end of the Week or Month. We all know that the bottom line can vary greatly from week to week. What do you do when you lost money one week? Do you have to take back the groceries? What a nightmare!
According to payscale.com, the average small business owner salary was $59k/year as of Nov 12th, 2017. With that in mind, that means we’re not all rolling in the dough, we’re trying to make ends meet. With that amount of money on the table, we can at least look at options to smooth out your personal paychecks.
Using probability and simulation, it is possible to set up a savings and salary plan that ensures you can pay yourself consistently 85%, 90% or 95% of the time.
The following models are focused on predicting the probability that you will have enough money to pay yourself a specified salary for any month.
Probability of Getting Paid in a Single Month
If we characterize the month to month variation of your profit in terms of Standard Deviation, then we can predict how probable it is that you’d make more than a specific profit going forward. I tried to graphically illustrate this in Figure 1 using a sample of $5,000 average monthly salary with ~$1,200 sigma. Sigma (σ) is calculated using Excel’s =STDEV.S() function with the last 12 months of monthly income. 1 Standard Deviation = 1 Sigma
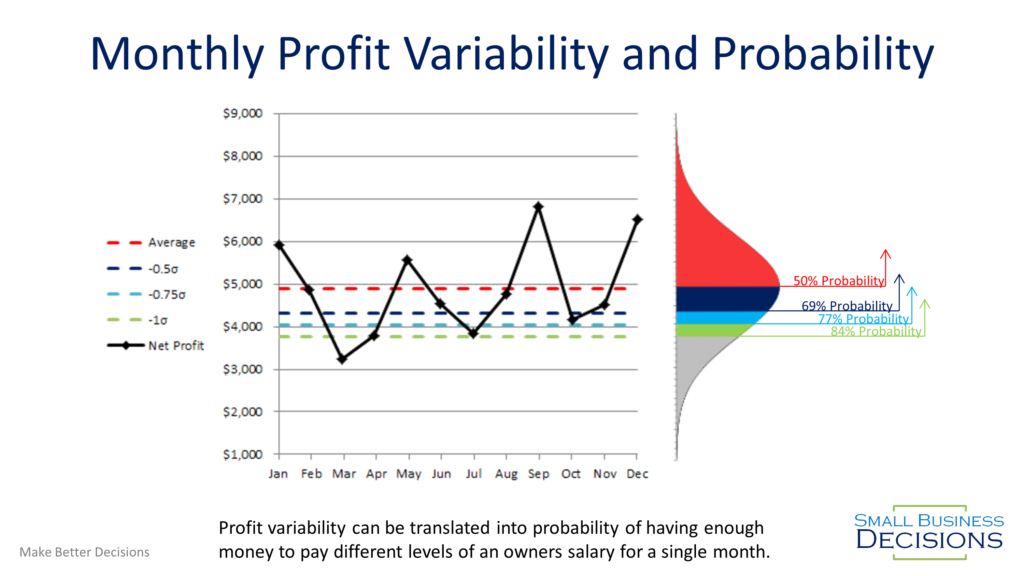
This approach gives us a great start to knowing what level of profit you can expect to take home on a monthly basis. If your business is stable enough, then you can probably just pay yourself 1 Standard Deviation less than your average on a monthly basis and then take home the extra as a periodic bonus.
There are a few potential issues with the simple approach. If you have two slow months in a row, then chances are, the second slow month will mean a severely reduced paycheck. Alternatively, if you have some savings built up in the company, you can start to pay yourself a bit more than the simple probability method suggests.
Probability of Getting Paid With Savings Allocated for Salary
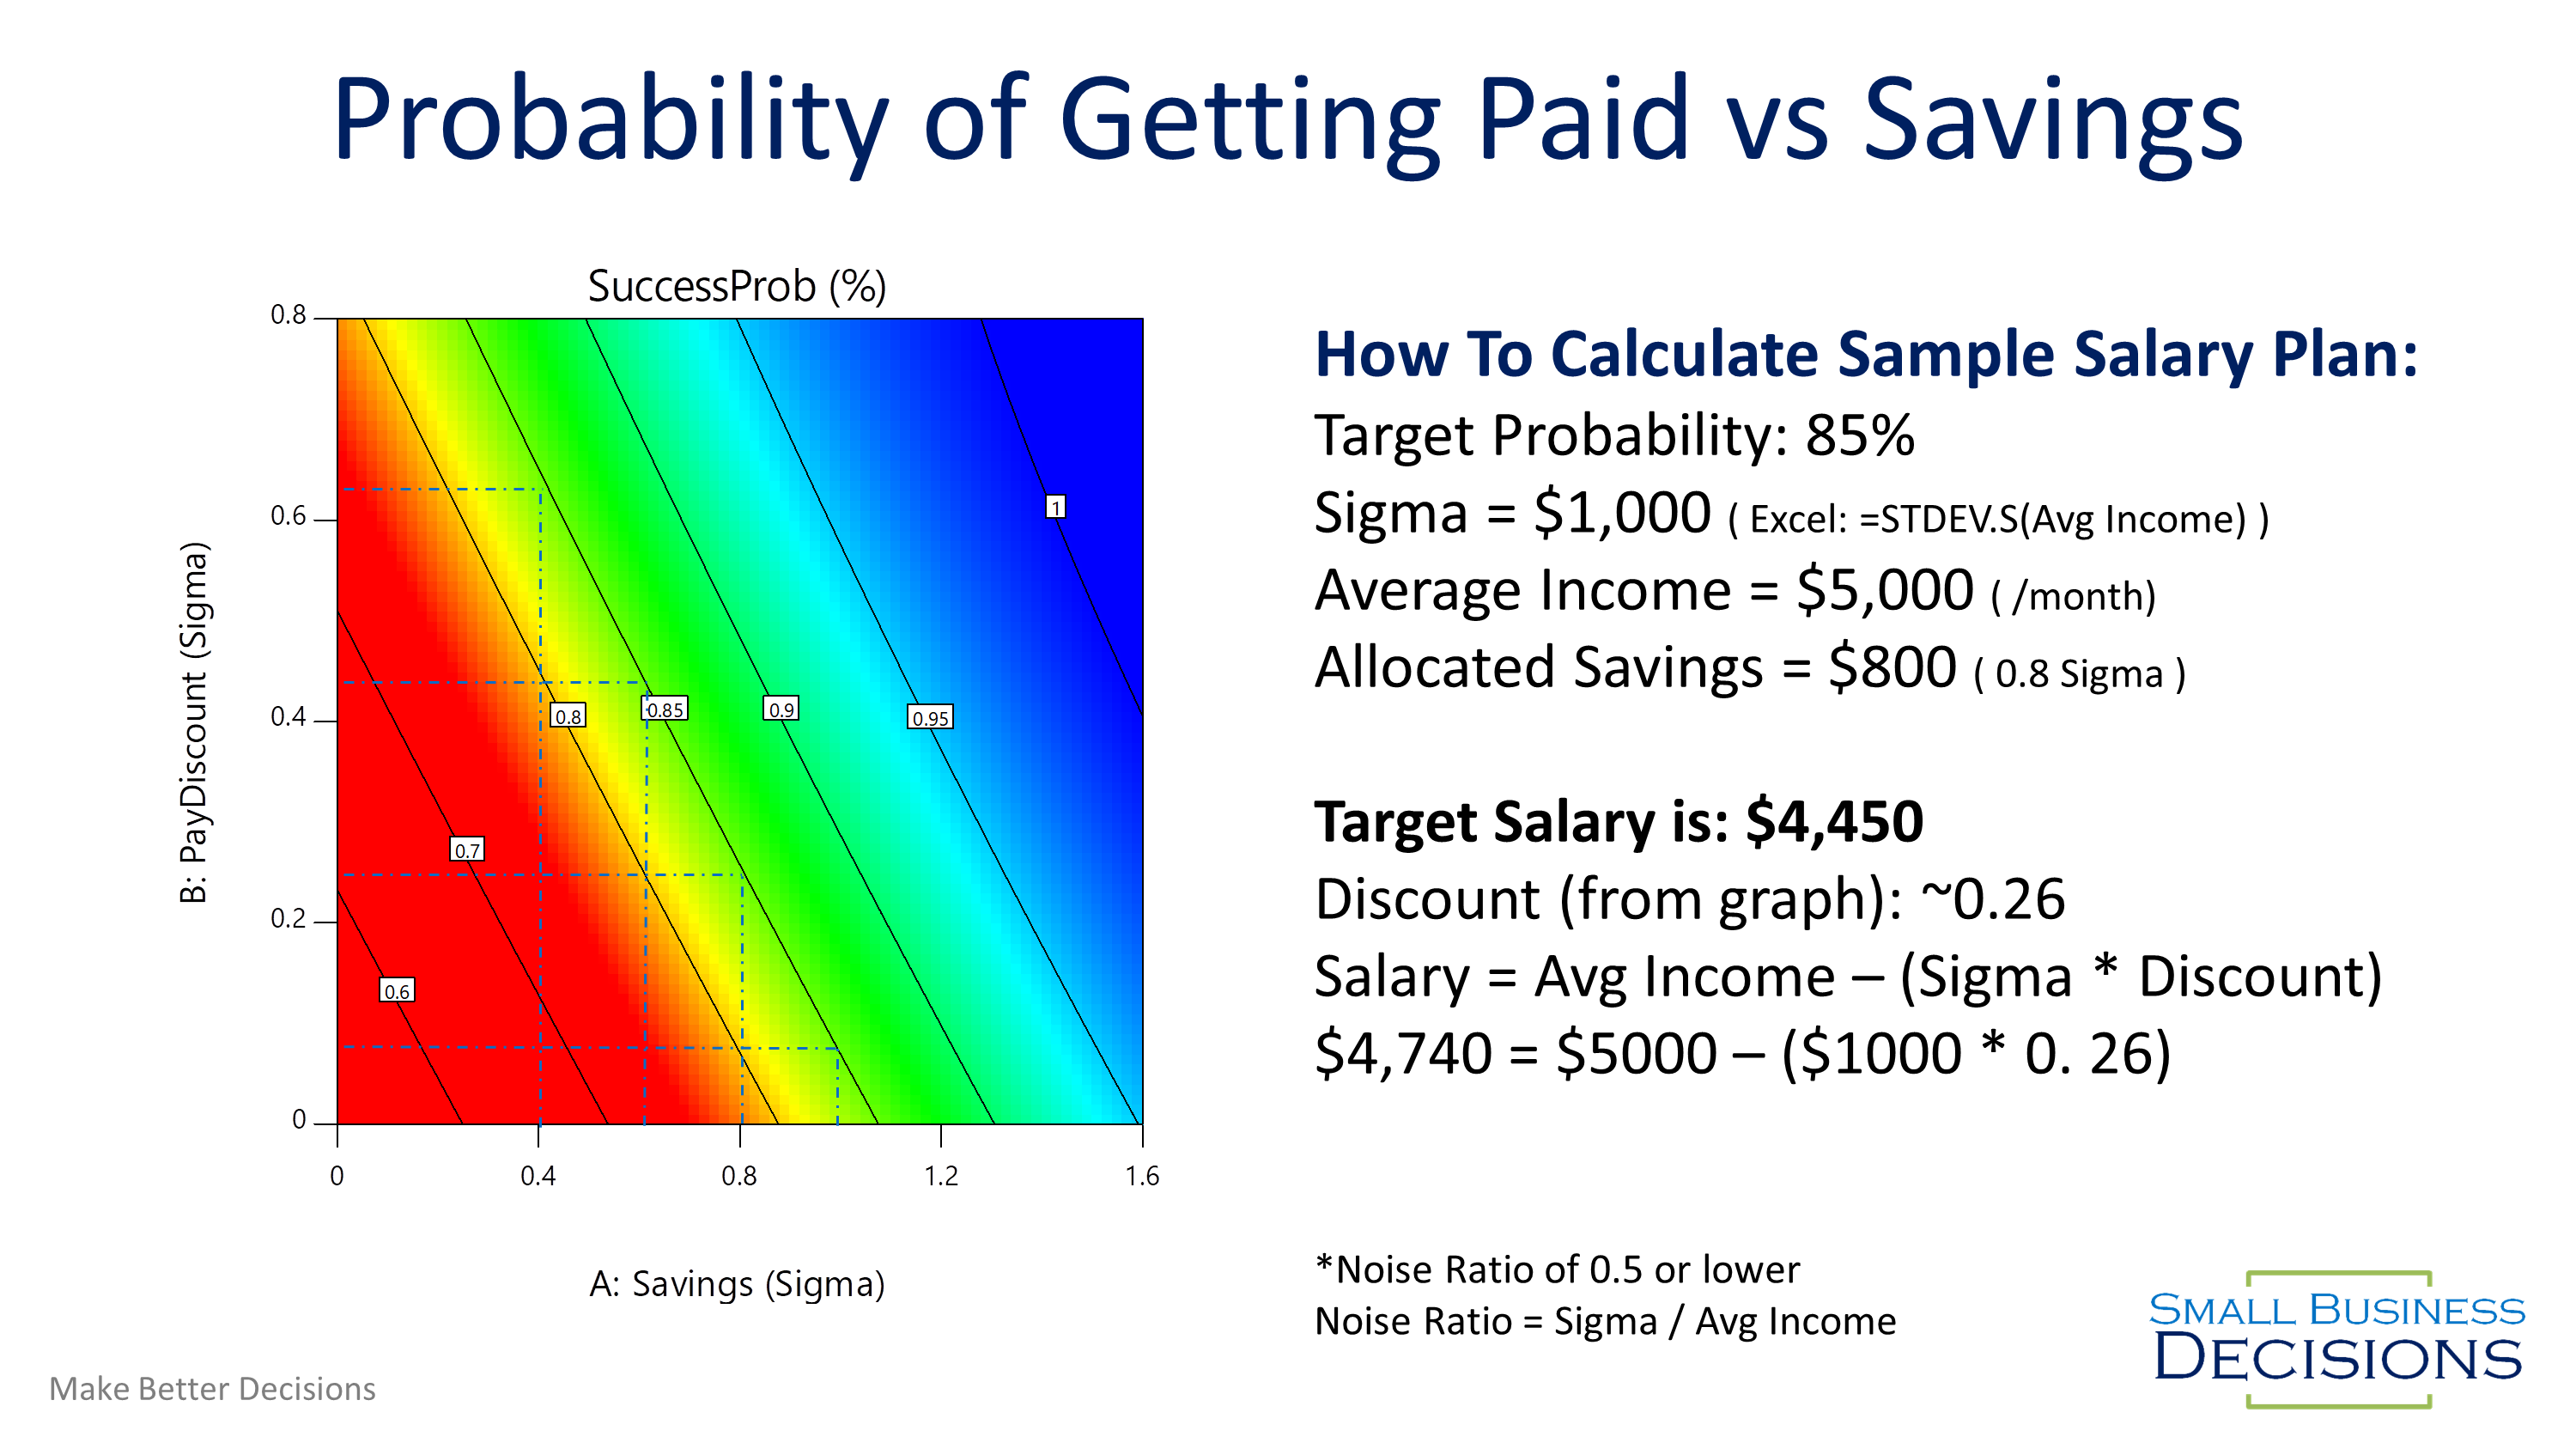
When we allocate a small amount of savings to make up for slow months, we can rely on a higher monthly salary. The allocated savings will make up for missing income on slow months. The model displayed in Figure 2 predicts the probability of being able to pay yourself a target salary after the allocated savings has been depleted (if needed).
I would suggest that you start with a target probability of 85%. This means that 10 months out of a year or more you will be able to take home your target salary. As you get savings built up or if having exactly the same income for all 12 months is more important, then you can use the 90% or 95% probability options.

How to Use the Probability Model:
You can download the calculator tool that was developed based on the model. In this tool you upload the last 12 months worth of profit data for your business and the tool will use the model to try and predict the probability that you can pay yourself a specific salary.
Owners Pay Calculator Download
If you don’t want to use the download you can use the following method and calculate a target owners salary manually:
- Measure Sigma for the last 12 months using Excel’s “=STDEV.S()” function
- Check that your “Noise Ratio” isn’t over 0.5 (Noise Ratio = Sigma / Avg Income)
- Calculate your Savings in terms of Sigma ( Savings in Sigma = Savings / Sigma )
- Use the model to look up what PayDiscount you need to use at your desired probability
- Calculate your Target Salary (Target Salary = Average Income – ( Sigma * PayDiscount )
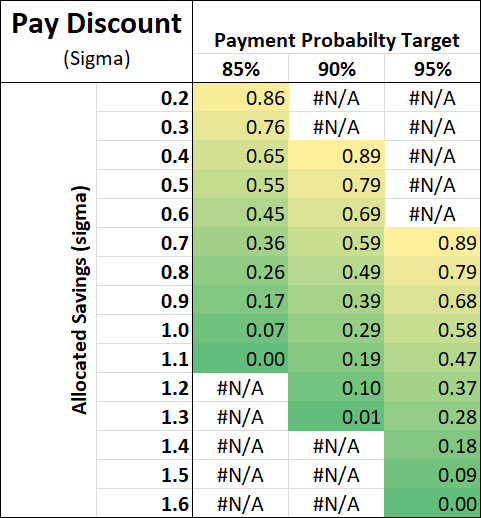
To make this easier, I created a table that has the Pay Discount in terms of savings and target probability. Don’t forget that the discount is in terms of sigma, not monthly pay discount, so you still need to calculate actual salary.
Quarterly Adjustments and Bonuses
This model was built based on 12 months of monthly income. With that in mind, you should evaluate the last 12 months of your business and set initial targets based on that data and then adjust on a quarterly basis. Any profit above and beyond your salary target gets added to the Allocated Savings account.
Each quarter, you re-evaluate what money is in the allocated savings and work out your preferred tradeoff between getting a bonus and having a higher monthly salary for the next three months. If you pay a bigger bonus, then your target salary will be lower and potentially have lower confidence. If you keep more of the money in your allocated savings, then you can pay yourself a higher salary and potentially use a higher probability column.
Things That Break the Model
The model makes some assumptions that are critical to making it work. If you have large changes to your operations, then the data we used to calculate your Sigma is no longer relevant to your future business performance.
In some cases, you may have significant seasonality or consistent growth that is higher than the suggested amount, which means you may need a custom model built. We can evaluate your specific business in our Consulting practice.
List of Things that Break the Model
If your business changes enough that the last 12 months aren’t a good representation of how your business operates today then there’s no way that any predictions based on the past will represent your future. In that case, you can re-evaluate with additional modeling, or when you have enough data to calculate a new Sigma. The model can handle some changes, but generally, anything in the list below is outside of the designed capability.
- More than 15% growth Year over Year
- More than 5% shrinking in profit Year over Year
- More than 15% swings in sales due to seasonality
- Significant changes in business spending or expenses (headcount, buildings etc)
- Large new contracts won or large existing contracts lost
- Large changes in working capital that are funded by profits
Does Your Business Have a Lot of Noise?
If you run the noise ratio and you’re above 0.5 this model won’t work for your business. If your noise ratio is 0.2 or higher, you probably have some opportunity to reduce noise in your business. Noise is usually an indicator of opportunity to optimize your business processes for higher and more consistent profits, or it’s an indicator or inconsistent monthly accounting close process.
You can download the eBook and it’s acompanying workbook here:
How to Turn Business Variation into Profits eBook
Basic Business Diagnostics
If you are not consistent in your processes, then that usually means there are profits that “fall through the cracks”. It also means you are only doing your best, most profitable work some of the time. Our consulting practice has a specialization in searching for opportunity in the noise. Noise is a great leading indicator for what activities offer better profit opportunity. Please check the Consulting page for more details.