

Anyone can open excel and build a forecast based on some set of assumptions. But without systematic methods and comprehensive data, the accuracy and usefulness of that forecast will be limited. Half of the trick for accurate forecasting is having the right data sources, the other half is process and tools.
“Useful” is a very important word in forecasting. The whole point of forecasting is to enable better forward-looking business decisions. Forecasting which is missing some critical components will do nothing to forewarn you that things are about to change. In this article, we’ll review the data sources, methods, and processes to show you how to build a useful financial forecast.
How to think about forecasting
There is a right way to think about forecasts when using them: Forecasts are a model of the market and the human habits that make up that market. Markets and the human habits that make up that market change slowly (most of the time). The force of habit and the slow changes in markets are what make forecasting good enough to be useful.
What makes a forecast useful?
The whole point of forecasting is to enable better forward-looking business decisions. Useful forecasts tell you that your business is about to change from previous trends, how much it’s going to change, and why it’s going to change. This makes the forecast useful because you have a chance to plan for and respond to the change that is about to come.
An unfortunate number of applications assume that projecting historical financial trends into the future will suffice. This will only catch market changes after they occur when it is too late to do anything about it.
Critical data inputs for a useful forecast
Useful forecasts must include leading indicators. Leading indicators come in many forms and modify the projection of historical trends. Figure 1 shows a sample of data sources which can develop a near-term and long-term forecast.
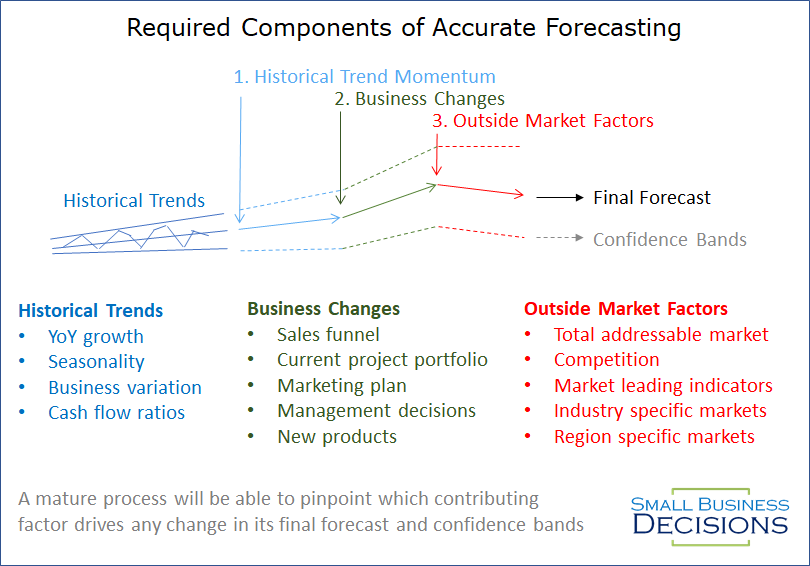
Figure 1. Required components of an accurate forecast.
Building the model
Start with at least 3 years of historical data, 5 or more is preferable. With this data, we’re going to identify historical trends and seasonality. Then we’re going to look for leading indicators which explain the residuals. Residuals are the unexplained variation between predicted and actual values.
Steps to searching for leading indicators:
- Model trends and seasonality
- Calculate residuals: the unexplained variation thus far
- Identify list of possible leading indicators to explain the variation from trends
- Search for statistical significance between residuals and leading indicators
- Validate feasibility with a market expert – VERY IMPORTANT!!!
- Build a model with feasible and significant factors
- Return to step 2 and repeat as needed with additional factors
Keep in mind that leading indicators can be less precise than historical trends. From a pure metrics standpoint, models without leading indicators may score higher than models with leading indicators. Usefulness is more important than great metrics, don’t forget that!
Calculate forecast confidence
There are two main camps of forecasting: Probabilistic and Deterministic forecasting. Deterministic forecasting makes a single point prediction. Probabilistic forecasting makes a prediction of the highest probability point and includes prediction interval bands, often at 95% confidence. A 95% prediction interval is the range which the next data point is 95% likely to fall within.
Ideally, we should all be using probabilistic forecasting. Probabilistic forecasting will give you upper and lower bounds for a prediction, which is so useful. The math is a bit more involved, but the excess of computing power we have today makes this a “cheap” tradeoff.
Uses for Prediction Intervals
Prediction intervals cover a multitude of use cases and address several weaknesses of deterministic forecasts:
- Worst case or conservative case is different for each department. Some departments want the high number, and some want the low number.
- Scenario planning can use the high and low bounds of Prediction Interval to determine a course of action that covers the majority of possible outcomes
- Months with high forecast confidence can spend more time optimizing ops plans for profitability
- Months with low forecast confidence can spend more time planning for a wide range of scenarios
- When low confidence is predicted, analysts can dig for better leading indicators in order to improve operations and improve the forecast for that specific market scenario
A note on Forecast Accuracy, the metric
Many forecasting packages will make deterministic forecasts and then measure and report Forecast Accuracy, the metric. This metric is easy to calculate and compare, but not very useful. It is dangerous to assume that historical forecast accuracy implies future forecast capability. Forecast Accuracy will be optimistic during transition periods, and is an average. Which means your prediction will be off by more than two times the Forecast Accuracy one month per year, most likely on transition months when the forecast is the most critical for decision making.
Critical process inputs
Your forecast should follow a review process. This gives you an opportunity to review the input data and its impact on the forecast. Each department has a different perspective, and a different use for the data. Some companies have each department review the forecast independently and some combine similar departments based on their company structure.
Departments that should be part of the review process:
- Sales
- Marketing
- Finance
- Product
- Ops
- Leadership
Most companies should build and review their forecast on a monthly basis. Some companies will benefit from forecasting weekly or daily. If you get much shorter than that, you’re starting to lean towards a machine learning basis for forecast execution, which we’re not talking about today.
State your inputs and assumptions
Since a forecast is just a model of market behaviors, make sure you state assumptions and what you actually modeled. The last thing you want is for a user of the model output assume your forecast has accounted for a market condition that you didn’t include. This would cause your forecast to be wrong, the plans based on wrong information, and future forecasts to not be trusted.
Forecasting is always useful, go try it
Usually, you will make more money by improving the accuracy of your forecast than it costs you to produce that forecast. Actively manage and be aware of that balance for your business. At a minimum, have a starting point, a forecast of some sort and a plan based on that forecast. If you need help or want to learn more, we offer specific and comprehensive forecasting solutions at our sister website: www.BetterForecasting.io